How to Read This Case Study
This is a reference programme, not a client engagement report. The organisation profile, figures, and timeline are a composite — representative of the mid-market omnichannel environments where this architecture applies — drawn from patterns observed across real enterprise data platform delivery. The design decisions, sequencing, and lessons are the reusable asset.
Programme Profile
Representative Organisation
Mid-sized omnichannel retailer — 500+ stores, growing e-commerce platform
Programme Duration
12 months
Modelled Investment
$1.8M over 12 months
Target Outcome
Unified disparate data sources, enabled real-time analytics across finance and HR
The Business Challenge
The Starting Point
The assessment phase of a programme like this reveals the same fundamental data architecture problems again and again — compounding across every function in the business.
PROBLEM 01
23 Disconnected Systems
Finance pulled numbers from their ERP while HR used their HRIS. Employee cost data between the two systems was sometimes off by 15–20%. No one knew which number was correct.
PROBLEM 02
No Single Source of Truth
During one leadership meeting, three departments presented three different revenue figures for the same quarter. The problem wasn’t the maths — each system defined “revenue” differently.
PROBLEM 03
Manual Data Movement
Analysts spent 70% of their time moving data between systems. The finance team had a person whose entire job was downloading reports from different systems and manually consolidating them in Excel.
Our Solution: Building a True Data Foundation
Instead of replacing everything at once, we focused on creating a unified data architecture that could bring all systems together without disrupting ongoing operations.
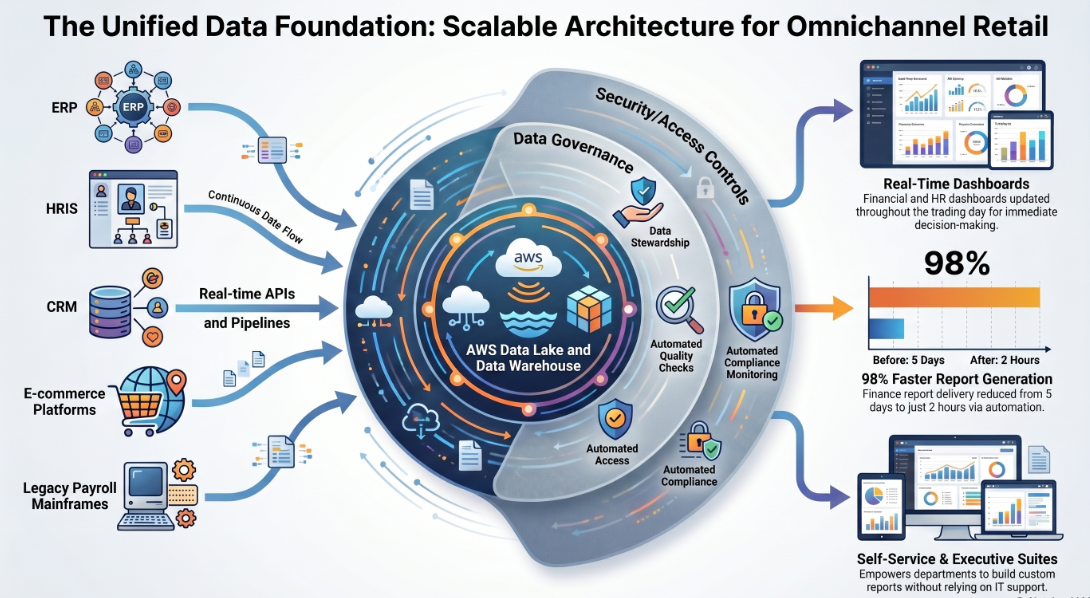
Cloud-Native Architecture
A hub-and-spoke AWS data lake ingesting from all existing systems — from the legacy mainframe running payroll to the modern cloud e-commerce platform. Key design goal: flexible enough to handle any source format, with real-time data flow replacing overnight batch jobs.
Unified Data Governance
Data stewardship roles assigned ownership of each data domain — Finance owned financial definitions, HR owned workforce metrics, IT maintained infrastructure. Automated data quality checks flagged problems at ingestion instead of letting bad data propagate into reports.
Enterprise Data Integration
APIs and pipelines pulling from ERP, HRIS, CRM, and e-commerce in real time. Standardised data models meant that when finance referred to “employee costs” and HR referenced “personnel expenses”, they were resolving to the same underlying record.
Implementation: 12 Months to Transform
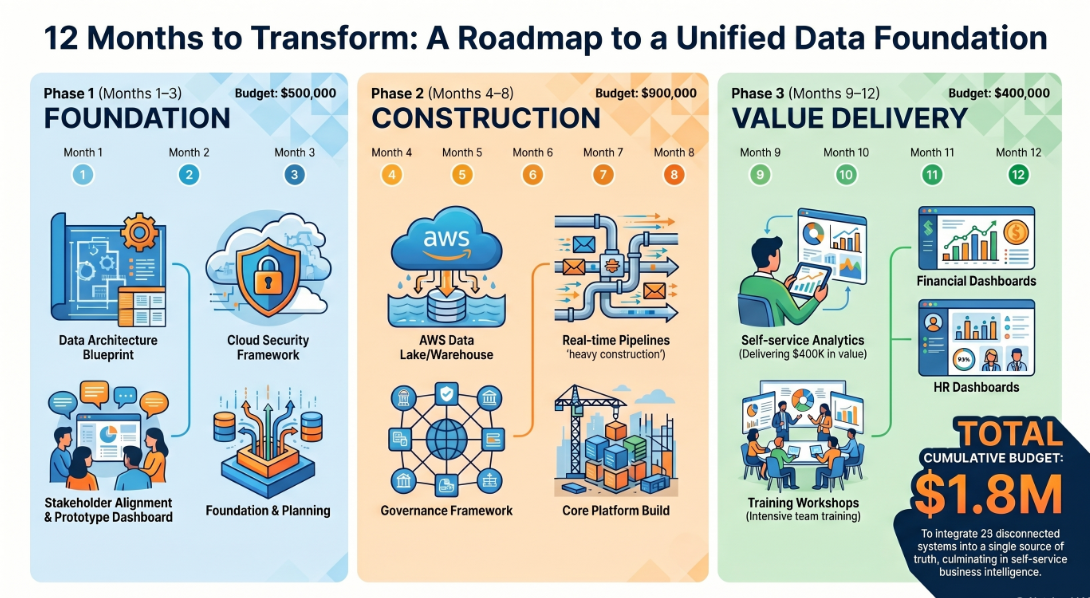
Getting stakeholder alignment was the critical first step. The finance director was skeptical about cloud security. The HR VP worried about data privacy. The turning point came when we demonstrated a prototype dashboard combining HR and finance data in real time — suddenly everyone could see the potential.
- Data architecture blueprint
- Cloud security framework
- Integration requirements documentation
- Stakeholder alignment on success metrics
The heavy construction phase. We migrated data to AWS, built integration layers, and established the governance framework while maintaining full business operations. The trickiest part was keeping existing systems running while fundamentally changing the data flow beneath them.
- AWS-based data lake and data warehouse
- Real-time pipelines from all major systems
- Data quality monitoring and alerting
- Security and access control framework
With clean, integrated data flowing reliably, we built the analytics and reporting capabilities that would deliver business value. Training was just as important as the technology — we ran workshops with finance and HR teams so they could build their own reports without waiting for IT.
- Self-service analytics platform
- Real-time financial dashboards
- HR workforce analytics
- Executive reporting suite
Outcomes the Programme Is Designed to Deliver
Finance Operations
Report generation
5 days → 2 hrs
End-to-end from request to delivery
Reconciliation discrepancies
−95%
Through automated data quality controls
Monthly close cycle
15 days → 8
Nearly halved through data automation
HR Analytics
Workforce Reporting
From manual quarterly reports to real-time dashboards updated throughout the day
Cross-Location Visibility
First time the organisation could see unified workforce metrics across all 500+ locations simultaneously
Compliance Reporting
Automated reports that previously took weeks to compile now generated on demand
Executive Decision-Making
Budget Planning
Cycle reduced from 6 weeks to 3 weeks — enabled by clean, unified data across all cost centres
Real-Time Visibility
Key performance metrics updated continuously throughout the trading day rather than from overnight batch runs
Conflicting Reports
Eliminated. One source of truth means one set of numbers in every meeting room
Platform Capabilities Delivered
Scalability
Architecture handles 10× current data volume and can add new data sources without rearchitecting
Reliability
99.7% uptime with automated failover and disaster recovery built into the cloud infrastructure
Security
Enterprise-grade controls exceeding the previous on-premise setup, with automated compliance monitoring
Key Lessons Learned
What Made This Successful
Executive sponsorship was non-negotiable. The CFO championed the project and removed organisational barriers when departments were slow to change processes. Without that authority, the cross-functional data definitions would never have been agreed.
Every technical decision started with a business question. “How does this help finance make better decisions?” — not “is this the most technically elegant approach?” That framing kept the programme on track when complexity threatened to overwhelm it.
Incremental value delivery maintained momentum. Instead of waiting 12 months for results, we showed progress every month with working demos and pilot capabilities. Each visible win made the next phase easier to fund and staff.
Data quality problems are always bigger than estimated. About 25% of historical data had problems — missing fields, duplicate records, inconsistent formats. Clean-up runs in parallel with build, not before it.
Technology is the easy part. Getting people comfortable with new ways of working — especially analysts giving up Excel-based processes they’ve used for years — requires time, training, and patience that most project plans underestimate.
What’s Next: Building on the Foundation
The platform is designed to grow. The next phase is focused on compounding the investment already made:
Advanced Analytics
With clean, integrated data available, the organisation can now build predictive models for financial forecasting and workforce planning that were simply impossible before
Additional Integration
Bringing in supplier data and customer data to create more comprehensive business intelligence across the full supply and demand picture
Self-Service Expansion
Training more business users to create their own reports and dashboards, reducing dependence on IT for routine analytics requests
Strategic Takeaways
The Core Principle
This project wasn’t about implementing the latest technology. It was about building a foundation that lets this organisation make better decisions faster than their competitors. The technology was the means; the business capability was the goal.
Start with problems
Don’t begin with technology. Start with specific business questions you need to answer faster and more accurately. The architecture follows from those requirements.
Invest in data quality early
Clean, reliable data is the foundation everything else builds on. Cut corners here and every downstream capability suffers. Budget for it explicitly.
Plan for 5–10× scale
It is much cheaper to build scalability in from day one than to rebuild a platform that is straining under growth. Design for the organisation you will be, not the one you are.
Budget for change management
Technology is the easy part. Getting people to change how they work takes time, training, and patience — and it should be a named, resourced workstream, not an afterthought.